
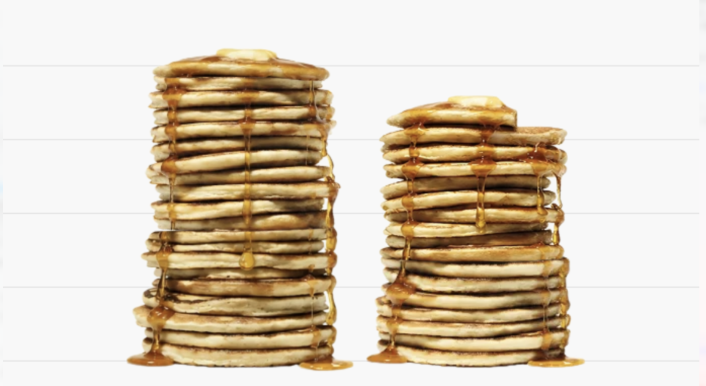
CORRECTIV’s Pancake Index makes the affordability of four staple foods tangible and comparable across Europe: flour, milk, eggs and butter. For 28 European countries, it calculates how many pancakes a median income could buy and estimates how this has changed over ten years.
We price a standard recipe of flour, milk, eggs and butter, then calculate how many pancakes 5% of that country’s daily median equivalised net income could buy in each country. Official inflation indices let us estimate what the same recipe cost in 2016.
This fixed budget share is illustrative, not observed food spending or a dietary recommendation. How much people actually spend on food varies by country and income group. The same 5% applies to every country, income group and year, so growth rates, group ratios and country ordering before rounding are unchanged from a full-income comparison — only the pancake totals are smaller. Display rounding can create ties.

Bitte nehmen Sie sich einen Moment Zeit.
Nachrichten und Recherchen sind unerlässlich, damit Sie sich eine Meinung bilden können. Aber die derzeitigen Bedrohungen der freien Presse und der Medienlandschaft sind alarmierend.
Wir fordern die Bundesregierung auf, Pressefreiheit und die Medienvielfalt in Deutschland umfangreich zu schützen. Machen Sie mit.
The comparison shows whether income kept pace with pancake ingredient prices. Today’s income is projected from the latest available data (see below), and ingredient prices combine official statistics with sampled retail observations. The results are estimates, not measured current incomes or national-average grocery prices.
The standard recipe
We use 280 g flour, 700 ml milk, 4 eggs and 50 g butter, yielding 10 pancakes. The recipe approximates the middle of the European pancake traditions we surveyed. All country comparisons use this fixed recipe.
In the pancake-stack graphics, one drawn pancake represents one pancake; the country-ranking graphic groups the icons into mini-stacks of ten pancakes.
Our data
We combine three sources of information:
- Inflation indices track changes in ingredient prices.
- Ingredient price estimates put a price on the recipe in each country.
- Income statistics how how much money people have available.
1. Inflation: Eurostat HICP
We use Eurostat’s Harmonised Index of Consumer Prices (HICP), with underlying ingredient indices rebased to January 2016 = 100(December 2016 for Norway). Ingredient price trends are indexed to the 2016 annual average and measures changes against that average, matching the article’s historical price baseline. Norway uses December 2016 = 100, its only available month that year. An index measures price change, not the price in euros.
Each ingredient maps to a product category in the ECOICOP version 2 classification:
| Ingredient | Code | Description |
| Flour | CP01112 | Flour of cereals |
| Milk | CP01141 (CP01142 for FI, LV, SE, MT) | Raw and whole milk; low-fat/skimmed where CP01141 is not published |
| Eggs | CP01148 | Eggs |
| Butter | CP01152 | Butter and other oils and fats derived from milk |
These categories do not match the ingredients exactly. Butter includes other milk-derived fats; Finland, Latvia, Sweden and Malta use the low-fat milk category. Norway’s history joins the old and new classifications, with Statistics Norway’s CPI (table 14700)providing the December 2025–March 2026 bridge and the January/February values. The older Norwegian observations come from Eurostat’s historical HICP dataset (prc_hicp_midx); the other ingredient observations come from prc_hicp_fpd.
For the separate food vs. general inflation graphic, the European Central Bank (ECB) calculated cumulative euro-area inflation at CORRECTIV’s request, supplying a spreadsheet with the underlying HICP data and calculation formulas. We updated its underlying series from the ECB Data Portal to the reference month used here. The graphic compares food excluding alcohol and tobacco with all-items inflation, with energy as a context line — not the four pancake ingredient categories. Changes are shown relative to January 2016. The underlying series are available from the ECB Data Portal for food, all items and energy. Eurostat publishes the original HICP statistics in prc_hicp_fpd.
The current HICP anchor is September 2026, shared by the ingredient series, food/all-items indices and the ECB graphic. All 28 countries have final observations at this anchor; Finland, Latvia and Sweden use the published CP01142 milk series. The anchor does not mean that every sampled retail price was observed in that month: source dates remain different, and sampled retail prices have not been newly normalised to the reference month.
2. Ingredient prices
Our cleaned pool contains 5,182 price records across 32 countries, collected from 36 sources through data downloads, APIs and web scraping. The Price levels tab shows the full pool; the article’s stacks and rankings cover 28 chosen countries.
The pancake stacks and country price curves use each country’s own ingredient-price estimates.
Sources overview
The cleaned pool combines official price statistics and government price feeds, volunteer-contributed prices from Open Food Facts Open Prices, and retailer and aggregator websites, catalogues and APIs. Not every source supplies all four ingredients.
| Country | Official statistics and price feeds | Open Food Facts | Retailers and aggregators |
| Austria | Statistik Austria Preisradar | ||
| Belgium | yes | Albert Heijn, Colruyt, Delhaize | |
| Bulgaria | Kolko Struva | ||
| Croatia | Mandatory price lists of Konzum, Lidl, SPAR/INTERSPAR and Tommy | yes | |
| Cyprus | e-kalathi | Alpha Mega | |
| Czechia | CZSO CEN0101N | Rohlík.cz | |
| Denmark | Salling Group (Bilka, Netto and føtex), nemlig.com | ||
| Estonia | METK | ||
| Finland | K-Ruoka (Kesko) | ||
| France | yes | Aldi-Nord | |
| Germany | yes | Aldi-Nord, Aldi-Süd | |
| Greece | PosoKanei, via a public archive of the official data | ||
| Hungary | KSH STADAT ara0044 | ||
| Ireland | CSO CPM12 | Aldi-Süd | |
| Italy | yes | easyCoop, Carrefour, Conad | |
| Latvia | CSP PCC010m | ||
| Lithuania | Statistics Lithuania S7R244 | ||
| Netherlands | CBS Agro-Nutri Monitor | yes | Albert Heijn, Aldi-Nord, Jumbo, Dirk van den Broek |
| North Macedonia | paket.mk, cenoteka.mk | ||
| Norway | yes | Oda, kassal.app | |
| Poland | GUS DBW | ||
| Portugal | yes | Continente | |
| Romania | INS TEMPO PPA101A | Auchan, Mega Image, Freshful, Carrefour | |
| Slovakia | ŠÚ SR sp1828ms | ||
| Slovenia | SURS 0411005S | ||
| Spain | MAPA household consumption panel | ||
| Sweden | yes | Willys (Axfood) | |
| Switzerland | yes | Aldi-Süd, Migros |
Units
Estimated shelf price in € per kg for flour and butter, € per litre for milk, and € per egg. Retail observations estimate shelf prices; official sources may instead report survey averages, scanner medians or household-purchase values. The combined pool therefore estimates consumer ingredient prices, not one uniform shelf-price statistic or a verified payable quote for every record.
We standardise package sizes and filter obvious errors and unsuitable products. Non-euro prices use official exchange rates: ECB rates where available, otherwise the relevant central bank. Sources were collected or retrieved in 2026, but describe different periods. Official statistics retain their survey periods; eligible Open Food Facts prices were observed in April–September 2026.
Confidence
Each country’s prices carry a confidence grade. Grade A marks strong evidence: an official national average, a government price observatory covering many chains, or a broad multi-source pool. Grade B marks real observed prices from a narrower base, like a single chain or city, volunteer-contributed records, or a pack-size or product-spec assumption. A country’s overall grade follows its weakest confidence ingredient (for example if we have good sources for all ingredients except butter, butter is leading in the grading). All 28 countries shown are graded A or B — A: AT, BG, CY, CZ, DE, EE, EL, ES, FR, HR, LT, LV, PL, SI, SK; B: BE, CH, DK, FI, HU, IE, IT, MK, NL, NO, PT, RO, SE.
As a cross-check, we compared our collected prices with Eurostat’s price level indices for food, which measure purchasing-power-adjusted price levels across countries as an index. We adapted our collection so that it does not deviate strongly from this benchmark.
Use of AI agents
We used AI agents to help develop the scripts that collect and clean the price data. The agents were research and programming tools, not a source of ingredient prices: the figures come from the published statistics and price records described above. The resulting data pass through the cleaning rules and validation checks described here. CORRECTIV remains responsible for the methodology and published results.
3. Income: Eurostat EU-SILC
We use the whole-population median equivalised net disposable income from Eurostat’s EU-SILC table ilc_di03. This is household income after taxes and contributions, including benefits, adjusted for household size and composition. Each person is assigned their household’s adjusted income; the median is taken across people in private households.
The 2025 survey describes 2024 incomes, except in Switzerland and North Macedonia, where it describes 2023. We project those incomes to September 2026 (2026-09) using all-items inflation. This assumes income kept pace with general prices after the reference year; it does not measure actual current income.
For the five income groups, or quintiles, we use shares from ilc_di01. Each group contains 20% of the population. Its mean income is calculated as income share (%) ÷ 20 × population mean income, with the population mean from ilc_di03. These are group means, not income cut-offs; the middle quintile’s mean is not the population median.
How we calculate the pancake stacks
1. Price the recipe. Multiply each ingredient quantity by its estimated price in that country and add the costs. Official statistics take precedence where available, except for Czechia’s four ingredients and Irish flour, which retain pooled prices. Official-only prices are brought forward from their survey periods using each ingredient’s inflation index.
The table illustrates the recipe using the country-balanced European reference prices, not any one country’s prices. Costs and shares are rounded.
| Ingredient | Quantity | Reference price | Cost | Share of basket |
| Eggs | 4 | €0.30 / egg | €1.20 | 40% |
| Milk | 700 ml | €1.27 / litre | €0.89 | 30% |
| Butter | 50 g | €12.08 / kg | €0.60 | 20% |
| Flour | 280 g | €1.03 / kg | €0.29 | 10% |
| Total | €2.98 | 100% |
2. Estimate the 2016 cost. Carry each ingredient’s current price back along its own inflation index, then add the recipe costs. We use the 2016 annual average for each ingredient, not one selected month. Norway uses December 2016, the only available month that year. The historical recipe cost is a backcast, not an observed 2016 shopping price.
3. Calculate affordability. Divide annual income by 365 to obtain a daily amount, allocate a fixed 5% of it as the pancake budget, then divide by the cost per pancake:
pancakes affordable = 5% of daily income ÷ (recipe cost ÷ 10)
The 2016 comparison uses the 2017 SILC survey, which measures 2016 incomes. Today’s comparison uses projected income. Quintile stacks apply the same 5% share to each group’s mean daily income instead of the population median. Counts are stored to two decimal places and displayed to one.
Counts are calculated in national currency so exchange-rate movements do not drive affordability. Displayed euro equivalents use the same selected exchange-rate basis for both income and recipe costs. Percentual change in pancake stacks is calculated using the underlying decimal numbers, not rounded figures shown in the graphs.
Limits and assumptions
- The quality of the price data varies between countries. Product and retailer coverage varies. Sources with more retained product rows can carry more weight within a country. Exact totals and close country rankings should be treated as estimates.
- Price periods and promotion treatment differ. Not all observations are aligned to September 2026. Each source retains its documented regular/current-price treatment; unknown promotion status does not establish a regular price.
- Two flagged groups are retained. Eight low-confidence Portuguese Continente rows are possible manufacturer-recommended-price (PVPR) proxies, not verified payable prices; the flag does not establish PVPR use for every row. Six Cypriot e-kalathi egg rows are cross-chain minima, or lower bounds, not ordinary per-chain prices.
- The 5% pancake budget is illustrative. Stacks show what 5% of a day’s income buys — not observed food spending, and not a recommendation to spend 5% of income on pancakes. The share is fixed across countries and years, so it does not affect growth rates, group ratios or country ordering before rounding.
- Today’s income is a scenario. Actual income growth may differ from inflation. Quintiles compare groups at each date, not the same households over time.