Data Journalism at CORRECTIV

We at CORRECTIV want to practise data journalism. This includes evaluating large amounts of data to help interested citizens make informed political decisions. We’re not looking to share random stories. The purpose of our investigative journalism is to uncover structural problems, misuse of power, mismanagement, or injustice. Our experience has proven that large amounts of data can be a great asset in this.

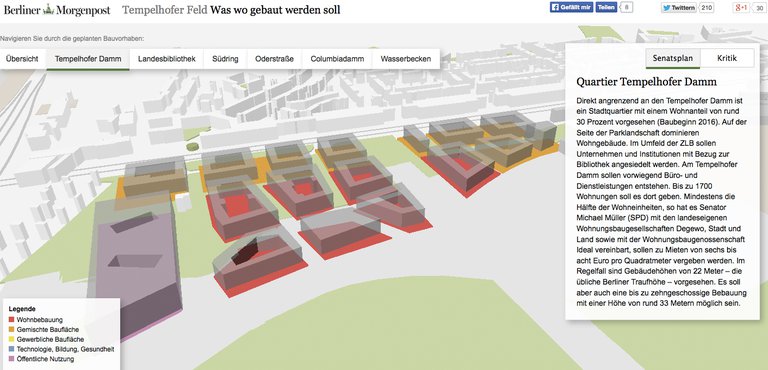
Visualizations and interactive graphics can illustrate complex issues in a way that is easily understood. Thus, even development plans can come alive, and it becomes possible to discuss upcoming changes in a very concrete and accessible way. Recently, for example, a public referendum took place in Berlin to decide on the future of the popular Tempelhofer airfield. Together with OKLab Berlin, I compiled an analysis of the building plans, a digital 3D-view of the old Berlin airport. Our work was then picked up by the Berliner Morgenpost. Its value was clear: we visualised the building plans in a comprehensible way, while illustrating various pros and cons of the upcoming decision at the same time.
The systematic mapping of power structures between politics and economics was also an important concern of ours. Such data is an important tool for journalistic research, but also builds the foundation of stories that can’t be told in traditional ways. What type of networks exist and how closely are they intertwined? Instead of writing thick books about puppet masters and power abuse, we provide a transparent and easily understandable analysis of issues. Projects such as MachtVZ or Lobbyplag inspired us to create our own network databases.
This type of journalism is something that we at CORRECTIV want to pursue consequently. Journalism that facilitates and empowers direct participation in political decision-making processes. Journalism that illustrates complex issues in a transparent way, for everyone.
For a long time, journalists had to rely on gathering anecdotes to describe issues. After hearing about a problem, they went out, talked to people, and wrote down their observations. Not a very solid foundation for arguments, since someone could always counter, „That’s just one case.“
When we compile and analyse large data sets, we make anecdotes quantifiable. We scrape data from the Internet, request entire databases from government agencies, or simply develop our own directories.
In this way, we can access and compare thousands, even millions of anecdotes with one click. We can expose underlying structures that no one has ever thought of before. The rule behind the individual case. The result is evidence-based journalism that delivers solid proof through data.
When we look at data, we don’t just see a bunch of numbers and figures – behind every entry, every number, lies the story of an individual. We want to tell these stories whenever possible.
Through this, we want to help our readers and users identify the real problem. Are you affected? If yes, how so? And what can you do about it? These are questions that every reader should be able to answer for him- or herself. A great example for this type of research is the project Dollars for Docs from ProPublica. It allowed US citizens to look up how much money their doctor was receiving from large pharmaceutical companies, essentially making it possible to determine how independent their consultations were.
